How to Read an HPLC Peptide Chromatogram
Last Updated: November 12, 2026
Quick Summary
An HPLC peptide chromatogram is a plot of detector signal against time that shows the separated components of a peptide mixture as individual peaks. Each peak records when a component eluted from the column and how much signal it produced, and purity percentages are derived from those peak areas.
- The x-axis is retention time in minutes from injection; the y-axis is detector response, usually absorbance in mAU.
- Retention time identifies a peak provisionally against a standard run under identical conditions, not by fingerprint.
- Tailing, fronting, and split peaks each point to specific separation problems such as column overload or co-elution.
- Purity is calculated by area normalization, dividing the main peak area by the total area of all integrated peaks.
- A chromatogram cannot establish peptide identity; mass spectrometry supports identity in a way a UV trace cannot.
Table of Contents
- What an HPLC Peptide Chromatogram Shows
- How to Read a Peptide Chromatogram Peak by Peak
- How to Read Peptide Test Results Against the Chromatogram
- How Peptide Purity Is Calculated from Peak Areas
- HPLC vs. LC-MS Peptide Testing: What Each Method Establishes
- Peptide HPLC Method Development and Why Retention Times Shift
- What a Chromatogram Cannot Establish
- Requesting Raw Chromatography Data with a Research Order
- Frequently Asked Questions
What an HPLC Peptide Chromatogram Shows
An HPLC peptide chromatogram is a plot of detector signal against time, and it shows the separated components of a peptide mixture as individual peaks.
The distinction matters for researchers evaluating how to read peptide test results. Hodges (2007) describe the main HPLC modes used for peptides, including size-exclusion, ion-exchange, and reversed-phase chromatography, and note that no single mode serves every separation problem (pubmed.ncbi.nlm.nih.gov).
The Axes and What Each One Measures
The x-axis is retention time, reported in minutes from sample injection. The y-axis is detector response, usually absorbance in milli-absorbance units when UV detection is used.
Reversed-phase HPLC with gradient elution is the most common arrangement for peptide work. The mobile phase changes composition over the run, so retention time is a function of both the peptide and the gradient program. Change the gradient, and every peak shifts.
How to Read a Peptide Chromatogram Peak by Peak
Reading a chromatogram means working through the trace in a fixed order: axes, baseline, the main peak, the surrounding peaks, and then the integration that turns the whole picture into a number. Each step answers a different question, and skipping one is how a clean-looking trace gets overinterpreted.
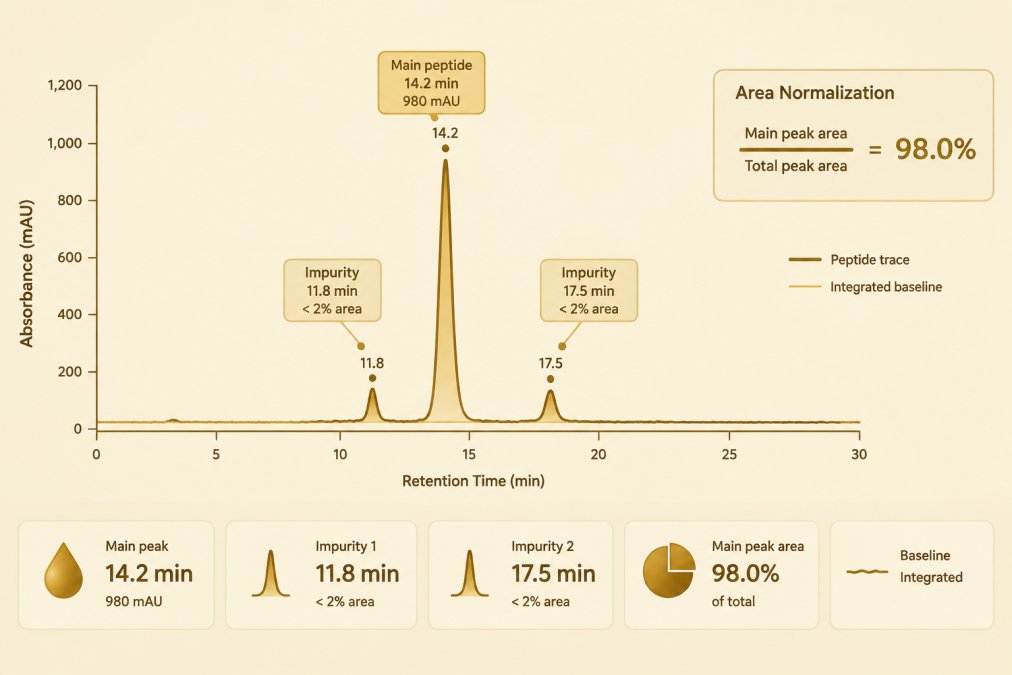
Step 1: Confirm the Axes and Units
The x-axis is retention time in minutes from injection; the y-axis is detector response, usually absorbance in milli-absorbance units (mAU) when UV detection is used. Before interpreting anything, confirm both scales and the detector wavelength, because a trace plotted at 214 nm and one plotted at 280 nm are not directly comparable, peptides absorb strongly near 214 nm through the peptide backbone, while 280 nm depends on aromatic side chains.
Step 2: Locate the Baseline
The baseline is the detector signal with no analyte passing through. Integration software places baseline points between peaks, and where those points land sets the denominator for every area calculation that follows. A drifting or noisy baseline, common with gradient elution as mobile-phase composition changes, makes baseline placement a judgment call rather than a fixed value.
Step 3: Identify the Main Peak by Retention Time
Retention time is the elapsed time between injection and the apex of a peak. It is a comparative measurement, not a fingerprint: a peak at 14.2 minutes in one method may appear at 13.6 minutes in another with a steeper gradient. Retention time identifies a peak provisionally, by comparison against a standard run under identical conditions, it does not confirm what the peak is.
Step 4: Read Peak Shape as a Diagnostic
Peak shape carries separation information that area alone does not. Tailing (a peak that trails asymmetrically toward later time) often points to secondary interactions with the stationary phase or an overloaded column. Fronting (a peak that leans toward earlier time) can indicate column overload or a solvent mismatch between sample and mobile phase. A split or shouldered peak suggests co-eluting components or partial degradation.
Step 5: Compare the Main Peak to Everything Else
The surrounding peaks define what the main peak is being measured against. Early-eluting peaks may be salts, solvent front, or hydrophilic impurities; late-eluting peaks may be more hydrophobic variants or aggregates. The region after the main peak deserves particular attention, because a cropped view that stops shortly after the target peak can hide late-eluting material entirely.
Step 6: Review the Integration
Integration is the software step that draws baseline segments and assigns an area to each peak. Integration thresholds, minimum peak width, minimum area, shoulder detection, determine which small features are counted at all.
A step-by-step walkthrough of this reading process is available in how to read a peptide HPLC chromatogram, which covers the same peak-by-peak mechanics in greater detail.
How to Read Peptide Test Results Against the Chromatogram
Peptide test results are read by matching the reported figure to the chromatographic evidence behind it. A purity percentage on a certificate of analysis should correspond to a specific integration window, a specific wavelength, and a specific method. When those parameters are absent, the number cannot be independently assessed.
Three checks apply to any reported result:
- Does the report state the detection wavelength and whether a single or multi-wavelength acquisition was used?
- Does it state the gradient program and column dimensions?
- Does it show the full trace, including the region after the main peak, rather than a cropped view?
A common mistake is treating a purity figure as a property of the compound rather than a property of the method. H.
How Peptide Purity Is Calculated from Peak Areas
Peptide purity is calculated by area normalization: the area of the main peptide peak is divided by the total area of all integrated peaks in the trace, and the result is expressed as a percentage. The arithmetic is simple; the inputs are not. Baseline placement, integration limits, and whether small shoulders are integrated at all change the denominator, and therefore change the reported figure.
Area Normalization in Practice
A worked example makes the dependence visible. If the main peak integrates to 9,700 mAU·min and all other integrated peaks sum to 300 mAU·min, area normalization reports 9,700 ÷ 10,000 = 97.0 percent. If the integration threshold is raised so that two small shoulders totaling 120 mAU·min are no longer counted, the same raw trace reports 9,700 ÷ 9,880 = 98.2 percent. Nothing about the sample changed, only the integration settings did.
Integration Thresholds and Excluded Peaks
Chromatography software applies minimum peak width, minimum area, and shoulder-detection settings that decide which features count. Peaks below the threshold are excluded from the denominator entirely. Some methods also exclude the solvent front and known injection artifacts by convention. A report that does not state these conventions cannot be independently reproduced, and a purity figure without them is a property of the method as much as of the compound.
Co-Elution and the Limits of Area Normalization
Area normalization measures relative UV-absorbing material, not chemical identity. Two components that co-elute appear as one peak and are counted as one, the impurity is invisible to the calculation even though it is present in the sample. Likewise, a minor peak may be a deletion sequence, an oxidized variant, or an unrelated contaminant; the percentage says nothing about which.
Method Dependence and Comparability
Because the denominator depends on wavelength, gradient, column, and integration settings, a purity percentage is only comparable between laboratories running equivalent methods. A figure reported at 214 nm with one gradient is not directly comparable to a figure reported at 280 nm with another. H.
A deeper guide to interpreting HPLC purity results explains how the peak-area percentage is derived and what it does and does not mean for a given batch.
HPLC vs. LC-MS Peptide Testing: What Each Method Establishes
HPLC and LC-MS establish different things. HPLC establishes that a mixture separates into components and reports their relative abundance by detector response.
T.
A comparison of HPLC, MS, and COA verification sets out how the chromatogram fits alongside identity testing when a compound is being evaluated. The chromatogram contributes the separation and relative-abundance record; the mass spectrum contributes the identity check.
Peptide HPLC Method Development and Why Retention Times Shift
Peptide HPLC method development determines what the chromatogram will show before any sample is injected.
Retention times shift when any of them change. A steeper gradient compresses the run and moves peaks earlier. A different column lot can alter selectivity slightly.
This is where the evidence base deserves a caveat. The supplied literature documents that these factors matter but does not quantify the magnitude of shift for specific peptides.
What a Chromatogram Cannot Establish
A chromatogram cannot establish peptide identity, and it cannot guarantee accurate quantification on its own. It records separation and relative detector response.
The contrarian point is worth stating plainly: a clean-looking trace is not proof of a pure compound.
Detector and wavelength effects compound the limitation. Peptides lacking strongly absorbing side chains produce weak signal at common UV wavelengths, so a low-abundance impurity may fall below detection entirely.
Requesting Raw Chromatography Data with a Research Order
Raw chromatography data lets a laboratory inspect the underlying trace rather than the summarized figure.
APEX 100 RESEARCH provides a batch-specific Certificate of Analysis with every order, confirming ?99% HPLC purity and molecular identity, with each batch verified through independent third-party laboratories in California. Researchers who need the underlying chromatogram for a specific batch can find the process described in how researchers access raw chromatography data, and batch-specific records are available through the certificates of analysis library.
What matters most when evaluating any supplier:
| What to Check | Why It Matters | Where It Appears |
|---|---|---|
| Detection wavelength | Determines which components are visible | COA method section |
| Gradient program | Governs retention time comparability | COA method section |
| Integration parameters | Sets the purity denominator | Raw chromatogram file |
| Mass spec confirmation | Establishes identity, not just separation | COA identity section |
| Full trace, uncropped | Shows minor and late-eluting peaks | Raw data request |
The central challenge in reading a peptide chromatogram is that the trace rewards careful interpretation and punishes assumption. A peak is a measurement, not a verdict. Specifications for each compound are listed in the research compound catalog.
For research use only, not only —. Not medical advice.
Frequently Asked Questions
What does a peak in a peptide HPLC chromatogram represent?
A peak represents a population of molecules that eluted from the column within a narrow time window and absorbed at the detector wavelength. In a reversed-phase separation, the main peak is typically the target peptide, while smaller peaks represent impurities, related peptide variants, or buffer components. Peak area is used to estimate relative abundance, and retention time serves as an analytical reference. Mant and Hodges (2007) note that reversed-phase, ion-exchange, and size-exclusion modes each resolve peptides by different properties, so the same sample can produce different peak patterns across methods.
Does an HPLC peptide chromatogram confirm molecular identity?
No. A chromatogram profiles separation and relative abundance; it does not establish what a peptide is. The supplied literature distinguishes HPLC purity profiling from mass spectrometry, which is used to assess molecular identity. A single peak at the expected retention time is consistent with the target peptide but does not rule out a co-eluting variant with a similar mass or hydrophobicity. Researchers typically pair HPLC with mass spectrometry before treating a batch as identity-confirmed, and a Certificate of Analysis should state which methods were run.
How is peptide purity calculated from an HPLC chromatogram?
Purity is usually reported by area normalization: the main peak area is divided by the sum of all integrated peak areas, then multiplied by 100. The result depends on integration settings, baseline selection, detector wavelength, and how many minor peaks are included. Herath and coauthors describe adsorption as a source of inaccuracy in peptide quantification, so a purity percentage should be read as method-dependent rather than absolute. The COA should name the column, gradient, wavelength, and integration approach used.
Why does retention time shift between HPLC runs?
Retention time in a peptide HPLC chromatogram responds to method and instrument variables: column age and lot, mobile-phase pH and ionic strength, gradient slope, column temperature, flow rate, and sample load. Small shifts of a few hundredths of a minute are routine; larger shifts suggest equilibration problems, mobile-phase preparation error, or column degradation. Because retention time is a relative reference, run-to-run comparisons are most reliable when the method is fixed and system suitability checks are performed before each sequence.