Understanding HPLC Purity Results: A Guide for Researchers
Last Updated: November 1, 2026
Quick Summary
HPLC purity is the target peak’s integrated area divided by total integrated peak area, expressed as a percentage under one set of detection conditions. It is not a certificate of chemical identity, and it only reflects what the detector sees.
- Area normalization assumes every component responds proportionally to the detector, which is rarely exact.
- Resolution (R) is calculated as 2(t? ? t?)/(w? + w?), with R ? 1.5 a common criterion for baseline separation.
- A sample can be 99% pure by area normalization and still fall short on assay.
- UV detection responds to chromophores, so salts, solvents, and saturated species can pass undetected.
- A purity percentage reported without method, wavelength, integration threshold, and system-suitability data is not comparable across conditions.
Table of Contents
- What HPLC Purity Results Measure and What They Do Not
- How to Read an HPLC Chromatogram Peak by Peak
- The HPLC Purity Calculation Behind the Percentage
- HPLC Purity vs. Assay: Two Different Numbers on a COA
- HPLC Purity Testing Limitations Researchers Should Know
- Peak Purity, System Suitability, and Orthogonal Confirmation
- Reviewing a Batch-Specific Certificate of Analysis Before Ordering
- Frequently Asked Questions
What HPLC Purity Results Measure and What They Do Not
Understanding HPLC purity results begins with a narrow claim: high-performance liquid chromatography separates the components of a sample and reports how much ultraviolet-absorbing material elutes at each retention time. A 2004 review in the Journal of Pharmaceutical and Biomedical Analysis describes HPLC analysis of drugs as serving to confirm identity and provide quantitative results (HPLC in pharmaceutical analyses).
Merit Sciences notes in its HPLC testing explainer that the method measures the target compound’s amount but does not establish that the detected compound is the one named on the label (HPLC purity testing explained). That distinction governs every downstream interpretation.
Purity Percentage, Peak Area, and Area Normalization
Purity percentage is the target peak’s integrated area divided by total integrated peak area, expressed as a percentage. Area normalization assumes every component responds to the detector proportionally, which is rarely exact. A co-eluting impurity with weak UV absorbance can inflate the reported figure without appearing as a distinct peak.
How to Read an HPLC Chromatogram Peak by Peak
Reading a chromatogram means matching each integrated peak to a retention time, checking baseline stability, and confirming that adjacent peaks are resolved rather than merged. The x-axis is retention time in minutes; the y-axis is detector response in milli-absorbance units (mAU). A peak-by-peak reading is a sequence of decisions, not a single glance at the tallest peak.
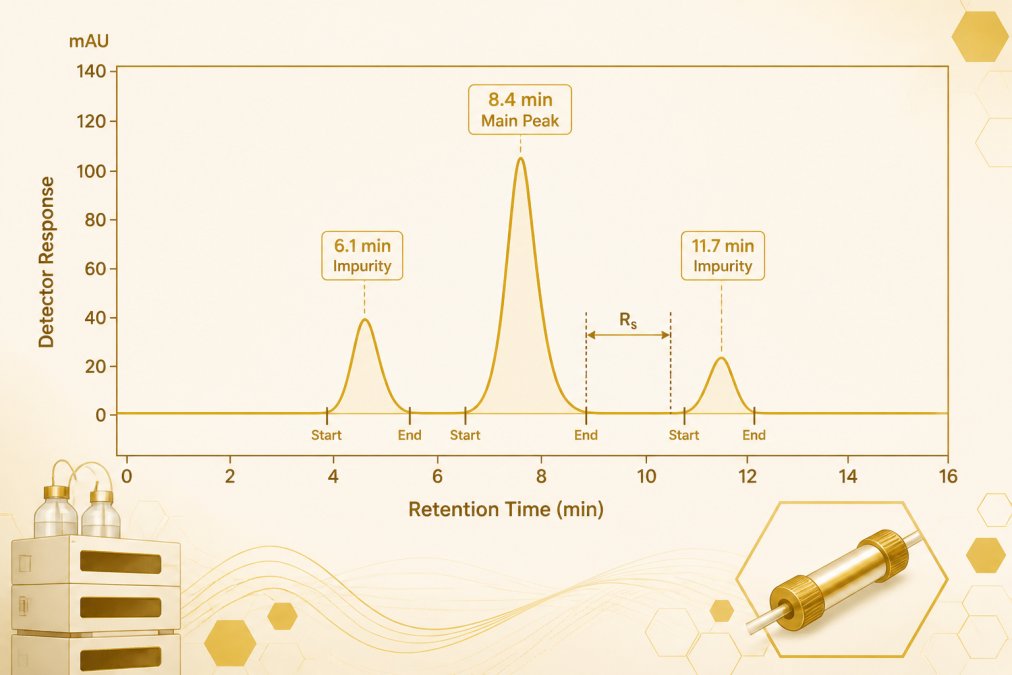
A Worked Walkthrough of an Annotated Chromatogram
Consider a representative reversed-phase separation run at a fixed UV wavelength, with the target eluting at 8.4 minutes. The reading proceeds in five steps:
- Confirm the run is interpretable. The baseline between 0 and 5 minutes should be flat within a few mAU; a sloping or drifting baseline in this region signals equilibration problems or gradient artifacts that will distort every later integration boundary.
- Identify the main peak. The target peak is the one whose retention time matches the reference standard run under the same method. Retention time is a provisional identifier only, it does not confirm structure, and a co-eluting species with the same retention time would be indistinguishable by this criterion alone.
- Integrate minor peaks. Peaks at 6.1 and 11.7 minutes are integrated separately only if the valley between each and the main peak returns to baseline. Where a shoulder is present, the integrator must decide whether to assign it to the main peak or to a separate impurity, a decision that changes the reported percentage.
- Check resolution between adjacent peaks. Resolution (R) is calculated as 2(t? ? t?)/(w? + w?), where t is retention time and w is peak width at baseline. A common acceptance criterion is R ? 1.5 for baseline separation; values below 1.0 indicate partial co-elution and unreliable area assignment.
- Record integration start and end marks. The integration window defines what counts. Extending the window to capture a late-eluting impurity lowers the reported purity; truncating it raises the figure.
A step-by-step walkthrough of reading a chromatogram peak by peak is available in this guide to interpreting HPLC chromatograms.
Retention Time, Baseline, and Resolution
Retention time identifies a peak provisionally; it does not confirm structure. Baseline drift, gradient artifacts, and void-volume disturbances all shift integration boundaries. Resolution between adjacent peaks determines whether two components are counted separately or merged into one area. The United States Pharmacopeia (USP) general chapter on chromatography (<USP 621>) is the standard reference for resolution, tailing factor, and theoretical plate calculations used in method suitability, researchers comparing laboratories should confirm that both parties apply the same definitions, because tailing factor and plate count formulas vary slightly between pharmacopeial and instrument-vendor conventions.
When two laboratories report different purity for the same lot, compare their integration windows and resolution values before assuming either result is wrong. Divergent integration choices are a more common cause than divergent chemistry.
The HPLC Purity Calculation Behind the Percentage
The HPLC purity calculation is arithmetic on integrated areas: target peak area divided by total peak area, multiplied by 100. The number is only as reliable as the integration decisions beneath it.
Integration Choices and Reporting Thresholds
Where an integrator places the baseline, and which shoulders it assigns to which peak, changes the reported percentage. Small peaks below a reporting threshold are often excluded, which raises the headline figure. Two laboratories analyzing the same lot can therefore report different purity values without either being wrong.
| Variable | Effect on reported purity | What to check |
|---|---|---|
| Integration baseline | Shifts peak area up or down | Manual vs. automatic integration |
| Reporting threshold | Excludes small peaks, raising purity | Stated threshold on the COA |
| Wavelength | Alters which impurities are seen | Detection wavelength recorded |
| Resolution | Merges or separates adjacent peaks | Resolution value between peaks |
HPLC Purity vs. Assay: Two Different Numbers on a COA
HPLC purity and assay answer different questions. Purity describes the proportion of integrated peak area attributable to the target; assay quantifies how much of the labeled content is present against a reference standard. A sample can be 99% pure by area normalization and still fall short on assay if the reference standard or the weighing is off. Readers comparing both values on a certificate benefit from a full guide to reading a certificate of analysis.
HPLC Purity Testing Limitations Researchers Should Know
The central limitation is that HPLC purity testing sees only what the detector sees. A high percentage reflects detected and integrated peaks under the method used; a misidentified compound or material invisible to that method may not be revealed by the percentage alone.
Detector Response Factors and Non-UV-Active Impurities
UV detection at a fixed wavelength responds to chromophores, not to mass. Compounds lacking a suitable chromophore, including many salts, solvents, and saturated species, can pass through undetected. Response factors differ between the target and its impurities, so equal peak areas do not mean equal quantities.
Peak Purity, System Suitability, and Orthogonal Confirmation
Spectral peak-purity analysis compares spectra across a peak to flag co-elution, and D. R. Stoll describes it as a spectral comparison with real limitations, noting that structurally similar compounds can require additional separation and complementary analytical evidence (Peak Purity in Liquid Chromatography).
System Suitability Metrics Researchers Should Check
System suitability establishes that the method performed as intended on the day of analysis. The metrics most commonly reported on a certificate, and the checks a reader can apply, include:
| Metric | What it measures | Typical acceptance criterion |
|---|---|---|
| Resolution (R) | Separation between the target and nearest peak | R ? 1.5 for baseline separation |
| Tailing factor (T) | Peak symmetry | T ? 2.0 for most pharmacopeial methods |
| Theoretical plates (N) | Column efficiency | Method-specific; higher N means sharper peaks |
| Repeatability (%RSD) | Injection-to-injection precision | Often ? 2.0% for replicate injections |
| Retention time %RSD | Run-to-run stability | Method-specific; drift signals column or mobile-phase issues |
These definitions follow the conventions in <USP 621> and are widely adopted in method validation under ICH Q2(R1). A result reported without system-suitability data is harder to defend, because the reader cannot tell whether poor resolution or a failing tailing factor distorted the integration.
When HPLC Purity Alone Is Insufficient
HPLC purity is a statement about detected, integrated peak area under one method. It does not establish identity, and it does not detect material invisible to the chosen detector. Orthogonal confirmation pairs HPLC with a technique that answers a different question:
- Mass spectrometry (MS) provides molecular mass and fragmentation information, supporting identity and revealing co-eluting species with different masses. A validated HPLC method for Ga-68-DOTATATE was reported suitable for chemical and radiochemical purity evaluation under the study’s operational conditions (HPLC method validation for Ga-68-DOTATATE).
- Nuclear magnetic resonance (NMR) provides structural information and can quantify components without requiring a chromophore, though sensitivity is lower than UV-HPLC.
- Charged aerosol or evaporative light-scattering detection (CAD/ELSD) responds to mass rather than UV absorbance, catching non-UV-active impurities that area normalization at a fixed wavelength would miss.
A deeper treatment of combined verification appears in this guide to verifying peptide purity with HPLC, MS, and COA data.
Troubleshooting Unexpected or Inconsistent Results
When a purity result is unexpected or differs across runs, a structured check is more useful than repeating the injection:
- Extra peaks appearing. Check mobile-phase preparation and column equilibration first; carryover from a prior injection and late-eluting peaks from the previous run are common causes.
- Drifting baseline. Confirm detector lamp stability, mobile-phase degassing, and gradient reproducibility. A drifting baseline shifts integration boundaries and inflates or deflates the main peak area.
- Poor resolution. Check column age, temperature control, and flow rate. Resolution below 1.0 means adjacent peaks may be merged, understating impurity content.
- Results differ across runs or methods. Compare detection wavelength, integration threshold, and reporting limits. Two methods at different wavelengths see different impurity profiles, and neither is wrong, they answer different questions.
- Results differ across laboratories. Request the system-suitability data and integration parameters alongside the result. Divergent integration choices, not divergent chemistry, are the most common explanation.
A purity percentage reported without the method, wavelength, integration threshold, and system-suitability data is not comparable to a result reported under different conditions. Researchers comparing lots should confirm that the analytical conditions match before drawing conclusions.
Reviewing a Batch-Specific Certificate of Analysis Before Ordering
A batch-specific certificate should state the method, detection wavelength, integration threshold, purity result, and identity confirmation for the lot in hand. Researchers evaluating batch documentation can review the certificate details for a given lot before ordering. For context on how low purity propagates into experimental error, this analysis of purity-driven result skew is a useful companion. For researchers working with specific compounds, the Research Compound Catalog lists available materials, and the Peptide Reconstitution Calculator supports accurate solution preparation once a lot has been verified.
The gap between a purity percentage and a defensible analytical conclusion is where most interpretation errors occur. APEX 100 RESEARCH supplies a batch-specific Certificate of Analysis reporting ?99% HPLC purity and mass spectrometry identity data for research compounds. Researchers can view the current catalog to source compounds with the analytical records in hand.
For research use only, not only —. Not medical advice.
Frequently Asked Questions
What does an HPLC purity percentage actually mean?
It is the share of the total integrated peak area accounted for by the target peak under one specific method. A 2004 review in the Journal of Pharmaceutical and Biomedical Analysis describes HPLC analysis as serving to confirm identity and provide quantitative results, but the percentage itself is an area-normalization figure. It reflects detected, integrated peaks only. Material that does not absorb at the detection wavelength, or that co-elutes with the main peak, is not counted against that number.
How is HPLC purity calculated from peak area?
The target peak area is divided by the total peak area of all integrated peaks in the chromatogram, then multiplied by 100. Integration parameters set the boundaries: where the baseline is drawn, how shoulders are split, and which small peaks fall below the reporting threshold all change the denominator. Two laboratories running the same sample under different integration settings can therefore report different purity percentages without either being wrong.
Does 99% HPLC purity mean a sample is 99% pure?
Not in an absolute sense. As Merit Sciences notes in its HPLC testing explainer, HPLC measures the amount of the target compound but does not establish that the detected compound is the one named on the label. The reported figure also depends on the method’s ability to detect everything present. A high percentage is a statement about integrated peak area at a given wavelength, not a guarantee that no undetected material remains.
What is the difference between HPLC purity and assay?
Purity is a relative, area-normalized figure comparing the target peak to all integrated peaks. Assay is an absolute measurement of how much target compound is present, typically against a reference standard of known concentration. A sample can show high purity and low assay if the material is largely composed of the target compound plus a large amount of non-UV-active counterion or water, which is why the two values answer different questions.
What are the main limitations of HPLC purity testing?
Three stand out. First, UV detection only sees chromophores, so non-UV-active impurities are invisible. Second, detector response factors differ between compounds, so peak area is not a direct proxy for mass. Third, Stoll’s work on peak purity in liquid chromatography describes spectral peak-purity analysis as a comparison with real limitations, noting that structurally similar compounds may require additional separation and complementary analytical evidence before a single-compound claim holds.
What should a peptide HPLC report include?
A useful report states the method, column and mobile phase, detection wavelength, retention time of the main peak, the integration parameters used, the calculated purity percentage, and the total peak area. It should also separate purity from identity confirmation and state which technique confirmed identity.