7 Ways Low Purity Skews Your Experimental Results
Last Updated: October 30, 2026
Quick Summary
Low purity alters experimental results because trace impurities enter reactions and compete with the intended substrate, shifting selectivity, product ratios and yields in ways that appear as anomalies rather than obvious failures. Purity and identity are separate measurements, and a chromatographically clean sample can still be the wrong molecule.
- Pauli and colleagues (2014) describe purity assessment as critical wherever chemistry is linked to biological or therapeutic outcomes.
- Co-elution, where an impurity shares the main peak’s retention time, is a documented limitation that area-percentage reporting cannot resolve.
- A 0.1% (w/w) impurity in a 1 mg/mL analyte is approximately 1 µg/mL, below many HPLC-UV detection limits but within LC-MS range.
- Reagent blanks, positive and negative controls, replicate lots and certified reference materials are described as the minimum set for attributing anomalies to purity.
- Changing suppliers mid-study without a bridging experiment is described as the most common way a reproducible protocol quietly stops reproducing.
Table of Contents
- How Trace Impurities Alter Chemical Reactions and Observed Reactivity
- HPLC Purity Analysis: Reading the Chromatogram Before It Ruins a Run
- Compound Identity Verification: Purity Is Not the Same as Correct Structure
- How Sample Contamination in Laboratory Experiments Distorts Test Results
- Batch-to-Batch Variability in Research: When the Same Catalog Number Behaves Differently
- A Troubleshooting Workflow for Detecting Purity-Related Errors
- Selecting Purity Grades and Documenting Them for Reproducibility
- Frequently Asked Questions
How Trace Impurities Alter Chemical Reactions and Observed Reactivity
The impact of low purity on experiments begins at the molecular level, where trace impurities enter a reaction vessel and change what happens inside it. The literature supports a clear conclusion: a reagent’s stated identity says nothing about the other species traveling with it.
Chemical purity is the fraction of a preparation consisting of the intended molecular species, with the remainder comprising residual solvents, synthetic byproducts, degradation products, and inorganic salts.
Side Reactions and Unexpected Byproducts
Impurities do not sit passively in solution. Many carry functional groups that compete with the intended substrate for the same reagent, producing unexpected byproducts never part of the experimental design.
The practical consequence is that reaction interference often appears as a yield anomaly rather than an obvious failure, one of the harder problems to diagnose, because the main product still forms.
Reaction Selectivity and Yield Shifts
Reaction selectivity is the preference of a reaction for one product over alternatives, and it is among the first parameters to move when reagent quality drifts. A shift in selectivity shows up as a changed product ratio that propagates into every downstream measurement.
- Lower selectivity: competing pathways consume substrate
- Changed ratios: isolation of the target compound becomes harder
- Apparent yield loss: material converts to species the assay does not detect
HPLC Purity Analysis: Reading the Chromatogram Before It Ruins a Run
HPLC purity analysis is the separation and quantification of a preparation’s components by high-performance liquid chromatography, reported as the area percentage of the main peak. It is the primary method by which purity claims are made and checked, and it is also the method most often misread.
A single main peak at a stated retention time confirms that one species dominates the chromatogram. The peer-reviewed purity analysis study by Ross and colleagues describes how time-temperature methods revealed unexpected behavior during purity determinations, a reminder that even established techniques can produce observations that complicate a simple purity number.
For a deeper walkthrough of reading chromatograms and mass spectra together, How to Verify Peptide Purity: HPLC, MS & COA covers the interpretation steps in sequence.
Compound Identity Verification: Purity Is Not the Same as Correct Structure
Compound identity verification is the confirmation that a preparation’s main component has the intended molecular structure, established by mass spectrometry and complementary techniques. Purity and identity are separate measurements, and conflating them is a common source of experimental error.
A sample can be highly pure and still be the wrong molecule, through synthesis errors, mislabeling, or degradation that preserves a single dominant species while altering its structure.
The distinction matters most in biological assays, where a structurally incorrect but chromatographically clean compound produces dose-response data that looks internally consistent and is entirely wrong. How to Confirm Peptide Molecular Identity in the Lab sets out the confirmation steps researchers use to close that gap.
How Sample Contamination in Laboratory Experiments Distorts Test Results
Sample contamination is the introduction of foreign material into a preparation during handling, transfer, or storage, and it is the most preventable source of distorted test results. Contaminants arrive through glassware, pipette tips, solvent reservoirs, and ambient air. The magnitude of the distortion depends on the contaminant’s identity, its concentration relative to the analyte, and the detection limit of the measurement technique, a framework the literature treats as central to analytical quality control.
Contamination Sources and Their Typical Signatures
- Glassware: detergent residue and leached ions, most often sodium, potassium, and borosilicate-derived silica; visible as elevated baseline in ion chromatography or as adduct peaks in mass spectrometry
- Pipettes and tips: carryover between samples, appears as cross-contamination in sequential runs, with the previous sample’s analyte appearing at low levels in the next blank
- Solvents: non-volatile residues after drying, leaves a gravimetric residue that can exceed the mass of a trace analyte; HPLC-grade solvents are specified for gradient elution and low UV absorbance at 210-254 nm
How Impurity Effects Differ by Experiment Type
A common pattern in the literature is that the same contaminant produces different consequences depending on the experiment. In analytical chemistry, a trace contaminant that co-elutes with the analyte inflates the reported concentration and is studied as a positive bias. In synthesis, a nucleophilic or electrophilic impurity competes for reagent and shifts product ratios, a selectivity problem rather than a quantitation problem.
Quantitative Examples and Impurity Thresholds
Universal impurity thresholds are not supported by the literature, the acceptable level depends on the analyte concentration, the detection limit, and the assay’s tolerance. What the literature does describe are illustrative relationships:
- If an impurity is present at 0.1% (w/w) and the analyte is at 1 mg/mL, the impurity is at approximately 1 µg/mL, a level that is below the detection limit of many HPLC-UV methods but well within the range of LC-MS detection
- If the same 0.1% impurity is a species that co-elutes with the analyte, the reported purity by area percentage can be overstated by a margin that depends on the relative response factors of the two species
- In trace metal analysis, contamination from labware is studied as a source of blank signal that can exceed the sample signal when analyte concentrations are in the low ng/L range
These examples are illustrative rather than prescriptive; the appropriate threshold for a given experiment is established empirically through blanks and controls.
Controls That Isolate Purity as a Variable
Distinguishing contamination from other causes requires controls that hold purity constant or vary it deliberately. Reagent blanks, the full workflow run without sample, establish the background contributed by solvents, glassware, and handling. Positive and negative controls confirm that the assay responds as expected when the analyte is present or absent. Replicate testing across independent lots distinguishes a batch-specific problem from a protocol-wide one. Reference materials with certified purity provide an anchor for comparison.
Contamination control is a workflow discipline, not a single step. Investigators who track lot numbers, use dedicated glassware, run solvent blanks, and document water grade and TOC for each preparation catch most problems before they reach an assay.
The article describes how common contamination sources show up as recognizable signatures in analytical results.
| Source | Typical contaminants | Signature |
|---|---|---|
| Glassware | Detergent residue, leached ions (sodium, potassium, silica) | Elevated baseline in ion chromatography; adduct peaks in MS |
| Pipettes and tips | Carryover between samples | Previous sample’s analyte in the next blank |
| Solvents | Non-volatile residues after drying | Gravimetric residue exceeding trace analyte mass |
| Atmosphere | Particulates, phthalates, siloxanes | Common MS background interferences |
| Water | Residual organics and dissolved ions | Specified by resistivity and TOC |
Batch-to-Batch Variability in Research: When the Same Catalog Number Behaves Differently
The variable that most often escapes notice is degradation rate. A lot that shipped at high purity can arrive at lower purity if temperature or humidity during transit was unfavorable. The catalog number is identical. The material is not.
This is why batch-specific documentation matters more than a catalog-level specification. Batch-specific Certificates of Analysis from APEX 100 RESEARCH are provided with every order, giving a researcher comparing two batches a documented basis rather than an inference from a shared part number.
A Troubleshooting Workflow for Detecting Purity-Related Errors
When a result looks wrong, purity is one hypothesis among several, and the goal is to confirm or exclude it quickly. The workflow below isolates purity as a variable before other explanations are pursued.
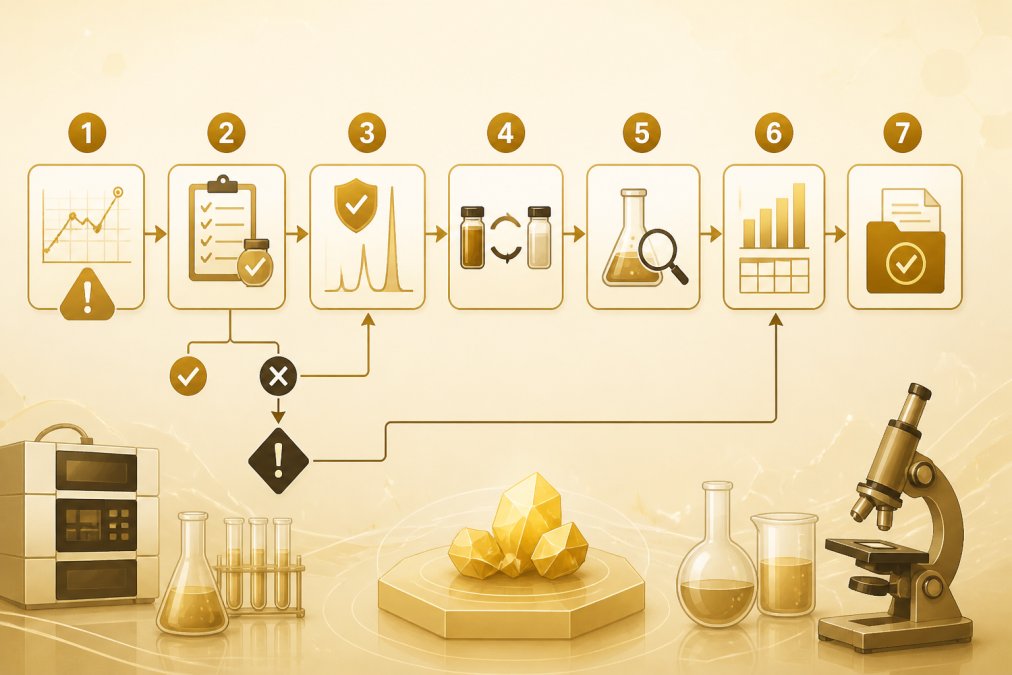
- Reproduce the anomaly on the same lot to rule out a one-off handling error
- Pull the COA and confirm the lot number matches the material in hand
- Run identity confirmation by mass spectrometry before assuming purity is the cause
- Test an independent lot of the same catalog number under identical conditions
- Compare against a reference standard where one is available
- Document the discrepancy with chromatograms and lot data, then raise it with the supplier
Reading the COA correctly is the step most often skipped. How to Read a Certificate of Analysis: 2026 Lab Guide explains which specification fields to check against the batch in hand.
Selecting Purity Grades and Documenting Them for Reproducibility
Reproducibility is the ability of an independent investigator to obtain the same result from the same protocol, and it depends on the material being what the protocol assumes. Selecting a purity grade is therefore a documentation decision as much as a purchasing one. The competitive literature tends to treat grade selection as a purchasing question; the practical gap is a decision framework that maps experiment requirements to grades and explains when higher purity is necessary and when it is not.
A Decision Guide for Selecting Purity Grades
The appropriate grade is set by the sensitivity of the assay to the impurities in question, not by a universal preference for the highest available grade. A common pattern in laboratory practice is to map experiment type to grade as follows:
- Qualitative screening and exploratory synthesis: technical or reagent grade is often sufficient where the readout is a visible color change, a melting point range, or a yes/no response; the assay tolerates higher background
- Quantitative analytical work (HPLC, LC-MS, ICP-MS): HPLC-grade solvents and Type I water (18.2 M?·cm, low TOC) are studied as necessary to keep background below the detection limit; trace-metal-grade acids are used where metal contamination would bias results
- Biological assays (cell viability, reporter assays, binding studies): grades specified as low-endotoxin and low-heavy-metal are investigated as necessary where the readout is sensitive to those contaminants; the evidence base for specific thresholds is thinner and more assay-dependent than in analytical work
Higher purity is necessary when the assay’s detection limit approaches the impurity concentration, when the impurity is known to interfere with the specific measurement, or when the experiment is intended to be reproducible across laboratories. It is not necessary when the assay tolerates background and the impurity does not participate in the measured response, in those cases, the additional cost and handling burden of a higher grade are not justified by the experimental requirement.
Documentation and Reproducibility Practices
Reproducibility depends on the material being documented at the batch level, not the catalog level. The practices the literature describes as necessary for audit and repetition include:
- Lot tracking: record the lot number for every preparation, and flag any mid-study lot change in the methods section
- Certificates of Analysis (COA): retain the COA alongside raw data, not in a separate filing system; the COA records the purity result, the identity method, and the specification fields against which the batch was released
- Storage conditions: note temperature, humidity, and light exposure, and record the date of first use; degradation during storage is studied as a source of purity loss that is not captured by the shipping specification
The ACS Publications review of natural-product purity by meta-analysis notes that molecular-weight differences between isolates and their impurities are often minor, which is precisely why chromatographic and spectroscopic documentation carries the burden of proof. For researchers choosing grades for a new study, Buying High Purity Peptides for Research: A 2026 Guide covers the selection criteria.
Gas-phase work adds another variable. The 2024 study on gas purity and nitric oxide reactivity by French and colleagues reports that purified nitric oxide mitigated oxy-hydride interferences and improved total ion sensitivity, particularly at high gas flows, showing that gas purity shapes observed reactivity in its own right.
Watch out: changing suppliers mid-study without a bridging experiment is the single most common way a reproducible protocol quietly stops reproducing. Where a study calls for a documented, lot-level specification, the Research Compound Catalog is the place to review available materials.
For research use only, not only —. Not medical advice.
Frequently Asked Questions
How does low-purity material affect experimental results?
Low purity introduces unmeasured variables into a system. Trace impurities can participate in side reactions, shift reaction selectivity, bind off-target in biological assays, and alter analytical baselines. The practical effect is that a result attributed to the test compound may partly reflect an impurity. Pauli and colleagues (2014) describe purity assessment as especially critical when chemistry is linked to biological or therapeutic outcomes, because an impurity present at trace levels can still produce a measurable response in sensitive assays.
What is the difference between purity and identity testing?
Purity testing measures how much of a sample is the intended material versus everything else; HPLC area percentage is the common readout. Compound identity verification confirms that the material actually is the structure claimed, typically through mass spectrometry or spectroscopy. A sample can be 99% pure by HPLC and still be the wrong compound, or correct in identity but degraded. Both checks belong on a Certificate of Analysis, and researchers should confirm both before committing a lot to a study.
Why is batch-to-batch consistency important in laboratory studies?
Batch-to-batch variability in research means a result generated with one lot may not reproduce with the next. If a study spans multiple lots, any shift in impurity profile, residual solvent, or water content becomes a confounder that is easy to miss. Recording lot numbers in the notebook and, where feasible, running a bridging experiment between lots lets researchers separate a real effect from a supplier-side change. Studies that do not track lots often cannot explain a failed replication.
How can researchers reduce sample contamination in vitro?
Most contamination in laboratory experiments enters through water, solvents, glassware, and handling. Practical controls include using freshly purified water, matching solvent grade to the assay’s detection limits, rinsing glassware with the same solvent used in the run, and preparing fresh solutions rather than storing dilute stocks. Running a blank alongside each batch shows whether contamination is present before it is attributed to the test article.