How to Read a Peptide HPLC Chromatogram: Step-by-Step
Table of Contents
- What a Peptide HPLC Chromatogram Actually Shows
- Step-by-Step: How to Interpret HPLC Data from a Peptide Run
- Peptide HPLC Retention Time and Compound Identification
- HPLC Peak Area Calculation and Relative Abundance
- HPLC Versus Mass Spectrometry for Peptide Identification
- Troubleshooting Abnormal Peaks in a Peptide HPLC Chromatogram
- Conclusion
- Frequently Asked Questions
Last Updated: October 18, 2026
What a Peptide HPLC Chromatogram Actually Shows
A peptide HPLC chromatogram is a two-dimensional plot of detector signal against time, produced when a peptide sample passes through a high-performance liquid chromatography column and separates into its component peaks. Learning how to read peptide HPLC chromatogram output means mastering two axes and the peaks that sit between them. This guide from APEX 100 RESEARCH breaks the process into discrete steps, from baseline assessment through integration and identity confirmation.
The chromatogram is not a purity certificate on its own. It is a separation record, and its meaning depends on method conditions, detector settings, and how the data were integrated.
The Time Axis: When Compounds Elute
The horizontal axis records run time in minutes. Compounds exit the column at characteristic points, and each exit time is a retention time. In reversed-phase chromatography (RP-HPLC), a peptide’s hydrophobicity governs when it elutes: more hydrophobic sequences bind longer to the stationary phase and appear later. Gradient elution with an increasing organic mobile phase is standard for peptides because it sharpens peaks across a wide hydrophobicity range.
The Detector-Response Axis: How Much Signal Reaches the Detector
The vertical axis records detector response, usually absorbance in milli-absorbance units (mAU) at 214 nm for peptide bonds. Peak height reflects how much material passed the detector at that moment. The scale is relative, not absolute mass, unless calibration standards are applied.
Step-by-Step: How to Interpret HPLC Data from a Peptide Run
Interpreting HPLC data follows a fixed sequence. Skipping steps produces misread peaks. The workflow below moves from baseline to identity confirmation, and each step is tied to a specific feature of a peptide chromatogram rather than to general HPLC theory.
- Inspect the baseline for drift and noise before examining any peak. A stable baseline is the precondition for valid integration.
- Identify the void volume marker and confirm column equilibration. The void volume is the retention time of an unretained species and sets the earliest point at which a peptide peak can be meaningful.
- Locate the target peptide peak by retention time against a reference standard run under identical method conditions.
- Check peak shape, symmetry, tailing, and resolution from neighbors, before accepting the peak as the target.
- Integrate peak areas and record relative area percentages, noting the integration settings used.
- Compare against method specifications and flag anomalies for orthogonal confirmation.
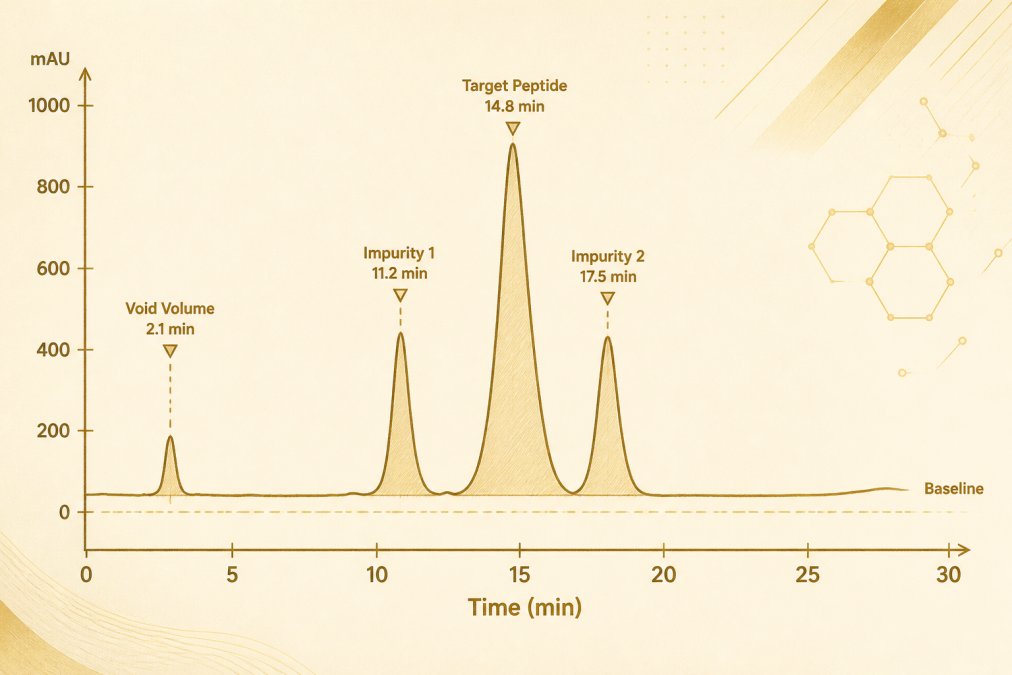
Reading the Annotated Example
The annotated figure above shows the features a reader should locate in order. The void volume marker at 2.1 minutes establishes the column’s unretained time; any signal before it is not a retained peptide. The target peptide peak at 14.8 minutes is identified by comparison to a reference standard injected under the same gradient. The two impurity peaks at 11.2 and 17.5 minutes flank the target and must be resolved from it, resolution is calculated as the difference in retention time divided by the average peak width at half height, and a value below roughly 1.5 indicates incomplete separation that will distort area percentages. The shaded regions under each peak represent integrated area, and the integration start and end points are themselves a judgment call that changes the reported numbers.
Reading Baseline Stability, Noise, and Peak Shape
Baseline stability is the flatness of the signal trace where no compound elutes. A drifting baseline signals column equilibration problems or mobile phase inconsistency. Noise is the short-term fluctuation amplitude; high noise masks small impurity peaks. Peak shape is assessed through symmetry and tailing factors. Tailing often points to secondary interactions with the stationary phase, and fronting can indicate column overload. For peptides, tailing is frequently investigated as a consequence of silanol interactions with basic residues and is studied alongside mobile-phase ion-pairing agents such as trifluoroacetic acid, which researchers describe as improving peak shape at the cost of ion suppression in mass spectrometry.
Reading Integration Settings and Report Output
Integration is not a neutral act. Software thresholds for peak width, slope sensitivity, minimum area, and baseline construction determine which signals are counted as peaks and where each peak begins and ends. A common pattern in peptide reports is that small shoulder peaks below the software’s area threshold are excluded, which raises the reported target-peak percentage without any change in the sample. Readers comparing certificates of analysis should confirm that integration parameters and any excluded regions are documented, because the same raw data can yield different area percentages under different settings.
Distinguishing the Target Peptide from Impurities
Retention time alone does not confirm identity. A co-eluting impurity with similar hydrophobicity can share the target’s retention time, and method-to-method shifts move retention times between runs. Researchers describe spiking a sample with a reference standard, observing whether the target peak grows without splitting, as a practical check, and orthogonal methods such as mass spectrometry as the definitive confirmation. The limits of the evidence base should be stated plainly: retention-time matching is a screening tool, not an identity test.
Peptide HPLC Retention Time and Compound Identification
Retention time is the elapsed time from injection to peak maximum, and it is the primary identification marker in a peptide HPLC chromatogram. A peak matching the reference standard’s retention time within method tolerance is tentatively identified as the target compound. Retention time alone is not definitive. Co-elution of an impurity with the target peak can hide contaminants, and method conditions shift retention times between runs. Reproducibility across injections is the practical test.
HPLC Peak Area Calculation and Relative Abundance
Peak area calculation integrates the detector signal under each peak, giving area under the curve. Integration software sums signal slices between peak start and end. Relative area, expressed as area percentage, divides each peak’s area by total integrated area. This is the figure most often reported as purity, and it is also the figure most often misread.
Why Area Percentage Is Not the Same as Purity
Area percentage is a relative measure within one detection channel. It does not account for compounds that do not absorb at the detection wavelength, nor for co-eluting species. A high area percentage for the target peak describes relative abundance in the UV trace, not absolute purity. Researchers describe this distinction as central to correct interpretation; purity claims require orthogonal confirmation.
The gap is larger than most readers expect, for four reasons that the literature treats separately:
- Detector-wavelength dependence. Peptide bonds absorb strongly near 214 nm, which is why that wavelength is standard for peptide work, but impurities without peptide bonds, salts, solvents, counterions, and many small-molecule contaminants, are effectively invisible at that wavelength. An area percentage at 214 nm therefore describes the peptide-bond-containing fraction, not the whole sample.
- Response-factor differences. Two peptides of equal mass do not produce equal absorbance, because response depends on the number and environment of absorbing bonds. Area percentage is a ratio of detector responses, not a ratio of masses, so it can over- or under-state the mass fraction of any given species.
- Co-elution. An impurity that elutes within the target peak’s integration window is counted as target. No integration setting can separate what the column did not resolve, which is why resolution from neighbors matters before area is trusted.
- Integration and method dependence. As noted above, slope sensitivity, minimum area thresholds, and excluded regions change which signals are counted. The same sample run on a different column chemistry, gradient, or temperature can produce a different area percentage without any change in composition.
What Area Percentage Can and Cannot Support
Area percentage is investigated as a relative-abundance descriptor within a defined method, and researchers describe it as useful for batch-to-batch comparison when method conditions are held constant. It is not studied as a substitute for absolute purity, mass fraction, or identity. The evidence base for treating area percentage as a purity certificate is thin, and the literature is consistent that orthogonal confirmation, mass spectrometry for identity and molecular mass, and where relevant quantitative assays for content, is required before a purity claim is made. A report that states a single area-percentage figure without method conditions, detection wavelength, and integration settings is not sufficient to evaluate purity.
Area percentage answers “what fraction of the UV signal at this wavelength came from this peak?” It does not answer “how pure is this material?” Those are different questions, and only the first is settled by the chromatogram alone.
HPLC Versus Mass Spectrometry for Peptide Identification
HPLC separates and quantitates; mass spectrometry identifies. HPLC versus mass spectrometry for peptide identification is not a contest but a pairing. HPLC with UV detection confirms retention behavior and relative abundance. Mass spectrometry supplies molecular mass and fragmentation data for compound identification. APEX 100 RESEARCH verifies every batch through both HPLC and mass spectrometry testing, and each order includes a batch-specific Certificate of Analysis confirming ?99% HPLC purity and molecular identity.
Troubleshooting Abnormal Peaks in a Peptide HPLC Chromatogram
Abnormal peaks fall into recognizable patterns. Each pattern maps to a likely cause and a corrective action.
| Symptom | Likely Cause |
Corrective Action |
|---|---|---|
|
Split or shouldered peak |
Partial degradation or column void |
Fresh sample prep; check column |
|
Excessive tailing |
Secondary interactions; overload |
Reduce load; adjust mobile phase |
|
Ghost peaks |
Carryover from prior injection |
Extended wash cycles |
|
Baseline drift |
Unequilibrated column |
Re-equilibrate before run |
Ghost peaks often trace to insufficient needle wash between injections. Extending the wash step resolves most carryover artifacts without method changes.
Conclusion
Reading a peptide HPLC chromatogram demands discipline: baseline first, peaks second, integration third, identity confirmation last. The literature is clear that area percentage alone cannot establish purity, and that HPLC and mass spectrometry are complementary rather than interchangeable. APEX 100 RESEARCH supplies research compounds with batch-specific COAs documenting ?99% HPLC purity and molecular identity, verified by independent third-party laboratories in California. Researchers seeking documented, US-sourced materials can review the research compound catalog.
For research use only, not only —. Not medical advice.
Frequently Asked Questions
How is peak area calculated in a peptide HPLC chromatogram?
Peak area is calculated through integration, where the chromatography software fits a baseline under each peak and sums the detector response across the retention-time window. The result, expressed in mAU·min or mAU·s, represents the area under the curve. Manual integration settings, such as baseline anchor points and peak-splitting thresholds, change the reported value, so the integration parameters should be documented alongside the result. Relative area percentage is then derived by dividing each peak’s area by the total integrated area.
What does retention time mean in peptide HPLC?
Retention time is the interval between sample injection and the apex of a peak reaching the detector. In reversed-phase chromatography, it reflects how long a peptide interacts with the stationary phase versus the mobile phase, driven largely by hydrophobicity and gradient conditions. Retention time supports compound identification only when compared against a reference standard run under identical method conditions. A match is consistent with identity but is not confirmatory on its own, and shifts in retention time can indicate column aging, mobile-phase drift, or co-elution.
Can an HPLC chromatogram confirm a peptide’s identity?
No. An HPLC chromatogram is a separation and relative-quantitation record; it shows that a component elutes at a given time and carries a given area, not what the molecule is. Confirmatory identification typically requires mass spectrometry, where the observed mass-to-charge ratio is compared with the theoretical mass of the peptide. Researchers describe HPLC and MS as complementary: HPLC establishes purity and consistency, while MS establishes molecular identity. A Certificate of Analysis that reports only HPLC purity without an identity method is incomplete for most research documentation needs.
What causes extra peaks in a peptide HPLC chromatogram?
Extra peaks can originate from the sample or the system. Sample-related causes include deletion sequences, truncation products, oxidation, deamidation, diastereomers, and residual counterions or salts from synthesis and purification. System-related causes include ghost peaks from carryover, mobile-phase contamination, air bubbles, column voiding, and gradient artifacts. Running a blank injection and a reference standard under the same method conditions helps separate the two categories. Peaks that appear in the blank but not the standard point to the system rather than the peptide.