Understanding HPLC Purity for Research: A Practical Guide
Last Updated: November 8, 2026
Quick Summary
HPLC purity is a relative measurement that reports the target peak area as a share of all integrated peak areas in a single chromatographic run, not an absolute or mass-based figure. It does not confirm identity, and it cannot detect non-chromophoric, inorganic, or non-eluting material. A purity figure should always be read alongside its method, integration parameters, and system suitability data.
- Area-percent purity divides the target peak area by the sum of all integrated peak areas and multiplies by 100.
- Area percent assumes equal detector response per unit mass, an assumption that rarely holds across differing structures.
- UV detection at a fixed wavelength misses non-chromophoric impurities, inorganic salts, and residual solvents.
- A peak passes spectral purity testing when the purity angle is lower than the purity threshold.
- A chromatogram cannot prove identity; mass spectrometry provides molecular weight confirmation that HPLC alone does not.
Table of Contents
- What HPLC Purity Actually Measures in Research Samples
- Reading a Chromatogram Step by Step
- How to Calculate Peak Purity in HPLC
- How to Calculate Purity Angle and Purity Threshold
- How to Calculate Peak Purity in Help
- HPLC Peptide Identity Testing: What a Chromatogram Cannot Prove
- Comparing Certificates of Analysis Across Methods and Providers
- Frequently Asked Questions
What HPLC Purity Actually Measures in Research Samples
High-performance liquid chromatography purity is a relative measurement, not an absolute one. It reports the area of the target peak as a share of all integrated peak areas in a single chromatographic run.
The technique separates sample components by passing a dissolved sample through a column packed with stationary phase, carried by a mobile phase.
Purity percentage, then, describes the relative amount of the target compound against other UV-absorbing material detected in that run. It does not confirm identity, and it does not measure material that never elutes or never absorbs.
Separation, retention time, and the integrated peak area
Retention time identifies when a compound exits the column. Peak area, calculated by integrating the detector signal under that peak, is proportional to the amount present. The sum of all integrated peak areas becomes the denominator in the purity calculation.
Two things follow from this. First, anything the detector cannot see is invisible to the calculation. Second, the integration parameters chosen by the analyst change the result.
Reading a Chromatogram Step by Step
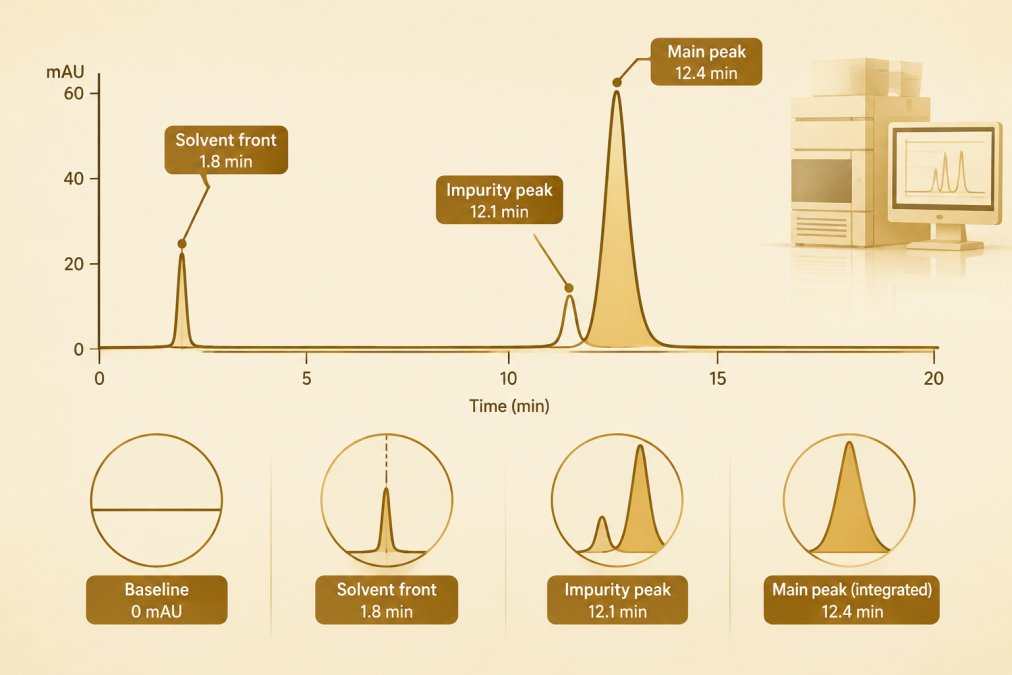
A chromatogram is read from left to right: the x-axis shows retention time in minutes, the y-axis shows detector response in absorbance units (mAU). The first feature is usually the solvent front, followed by the target peak and any impurity peaks.
Work through the trace in this order:
- Locate the solvent front and note the void time
- Identify the main peak and record its retention time
- Check peak shape for fronting, tailing, or splitting
- Review every integrated impurity peak and its area
- Confirm the baseline is flat and integration is consistent
- Compare the trace against the method’s system suitability criteria
A worked area-percent calculation
Area-percent purity is the target peak area divided by the sum of all integrated peak areas, multiplied by 100. A worked example makes the arithmetic concrete. Suppose integration returns a main peak area of 9,842,000 mAU·s, a leading impurity of 41,000 mAU·s, a trailing impurity of 18,500 mAU·s, and a small late-eluting peak of 6,200 mAU·s.
Watch out: a baseline drawn through a small impurity peak can move the reported area percent by more than the impurity’s true share, so the integration settings deserve as much scrutiny as the peak itself.
Why area percent is not mass percent
Area percentage assumes every eluting compound produces the same detector response per unit mass. That assumption rarely holds. Molar absorptivity at the detection wavelength varies by structure, so a chromophore-poor impurity can be present in larger mass than its peak area suggests, while a strongly absorbing impurity can be overrepresented. The literature describes area-percent purity as a relative measure whose relationship to mass or molar purity depends on relative response factors, values that are often unknown for unspecified impurities. A clean area percent therefore bounds the visible impurity profile, not the true mass balance.
What the detector cannot see
UV detection at a fixed wavelength reports only material that absorbs at that wavelength and elutes within the run. Non-chromophoric impurities, inorganic salts, residual solvents, and material that remains on the column or never elutes are invisible to the calculation. A high area percent is consistent with a substantial invisible fraction. Researchers reading a certificate of analysis should treat the reported figure as a statement about the UV-visible, eluting portion of the sample under one method, nothing broader.
A deeper walkthrough of this process is available in how to read a peptide HPLC chromatogram step by step.
How to Calculate Peak Purity in HPLC
Peak purity is calculated by comparing spectra taken across a single peak. If the detector response at the apex matches the response on the leading and trailing edges, the peak is spectrally pure.
The calculation uses diode-array detector data collected at multiple wavelengths. Software computes a similarity or match factor between spectra, and a threshold decides whether the peak passes.
This is where method dependence becomes visible. Structurally similar compounds are difficult to resolve, and peak-purity assessment using diode-array detector data is described in the literature as a tool for exactly that problem, with acknowledged limits when separation is poor.
How to Calculate Purity Angle and Purity Threshold
Purity angle and purity threshold are paired values generated from spectral data across a peak. The purity angle measures spectral change within the peak. The purity threshold is the maximum angle expected from noise alone for that method and peak.
The rule is simple: if the purity angle is lower than the purity threshold, the peak passes the spectral purity test. If the angle exceeds the threshold, a co-eluting impurity is indicated.
Neither value proves identity. Both describe spectral consistency within one peak under one set of conditions.
How to Calculate Peak Purity in Help
Software purity views, whether in a chromatography data system’s help documentation or a standalone spectral library tool, plot purity angle against purity threshold across a peak and flag regions where the angle crosses the threshold. The mechanics are straightforward: select the spectra, define the wavelength range, set spectral resolution, and review the resulting purity plot. What the software cannot do is tell the reader whether the underlying method was fit for purpose. That judgment rests on system suitability and method validation, and it is the part most guides omit.
System suitability: the run-level gate
System suitability checks confirm that a given injection set met the method’s acceptance criteria before any result is reported. Common parameters include:
- Resolution between the target peak and the nearest impurity, typically required to be at least 1.5, and often 2.0 for closely eluting critical pairs
- Tailing factor, commonly required to be no more than 2.0, since severe tailing distorts integration
- Theoretical plates, a measure of column efficiency that must meet a method-defined minimum
- Repeatability of replicate injections, relative standard deviation of peak area usually required to be no more than 2.0 percent
- Signal-to-noise for the limit of quantification, where impurity reporting thresholds apply
A reported purity figure that arrives without system suitability data is a number without a gate. The run may have met criteria, but the reader cannot confirm it.
Method validation: the method-level gate
The validation package establishes that the method measures what it claims across its intended range. The parameters most relevant to purity reporting are specificity (does the method resolve the target from known and unknown impurities?), precision (repeatability and intermediate precision), accuracy (recovery against a reference standard), linearity and range (does response track concentration across the working range?), and detection and quantification limits (what impurity level can the method reliably see and measure?). HPLC method validation literature notes that some validation parameters may not apply to a given method, so validation scope is specific rather than universal.
Reading a purity result against its method
A purity figure should be read alongside four pieces of method information: the column and mobile phase (which determine selectivity), the detection wavelength (which determines what is visible), the integration parameters (which determine how area is assigned), and the system suitability data (which determines whether the run was valid). When any of these is missing, the figure is a claim rather than a measurement.
Watch out: a wide wavelength range and generous spectral resolution in a purity view can mask small spectral differences, so the settings must match the validation package rather than the software defaults.
What most guides miss is that the software output is only as good as the method behind it. The settings must match the validation package, and the validation package must match the claim being made.
HPLC Peptide Identity Testing: What a Chromatogram Cannot Prove
A chromatogram cannot prove that the peak is the intended compound. It can only show that one peak dominates the UV trace. A sample of an entirely different substance, free of contaminants, would produce a high purity percentage too.
Identity requires an orthogonal method. Mass spectrometry provides molecular weight confirmation, which HPLC alone does not.
For research compounds, identity confirmation and purity measurement are separate claims that must be documented separately. A broader treatment of combining HPLC, MS, and COA data is covered in how to verify peptide purity with HPLC, MS and COA.
Comparing Certificates of Analysis Across Methods and Providers
Certificates of analysis are only comparable when the methods behind them are comparable. Two COAs reporting the same purity figure can rest on different columns, mobile phases, wavelengths, and integration settings.
Use this comparison framework when evaluating documents from different providers:
| Element to Check | Why It Matters | What to Look For |
|---|---|---|
| Analytical method named | Purity is method-dependent | Column, mobile phase, detection wavelength stated |
| Integration parameters | Baseline choices shift area percentage | Method reference or software settings disclosed |
| Identity confirmation | HPLC cannot prove identity | Mass spectrometry result included |
| System suitability data | Shows the run met method criteria | Resolution, tailing factor, repeatability |
| Raw data availability | Allows independent review | Chromatograms and spectra on request |
A reader comparing documents from several sources will benefit from guidance on how to read a certificate of analysis. Batch-specific records showing HPLC purity results alongside mass spectrometry identity checks are published in the APEX 100 RESEARCH certificate of analysis library, which lists the testing documentation supplied with each batch.
Purity figures are easy to quote and harder to interpret. The work sits in matching the number to its method, its integration, and its identity confirmation. Review the research compound catalog to see the documentation provided with each batch.
For research use only, not only —. Not medical advice.
Frequently Asked Questions
How is purity calculated using HPLC?
Purity is usually reported as area percentage: the integrated area of the target peak divided by the sum of all integrated peak areas in the chromatogram, multiplied by 100. This is a relative measurement of what the detector saw at a given wavelength, not an absolute measure of chemical purity. Results depend on the analytical method, including column, mobile phase, gradient, and detection wavelength. A 99% area percentage means 99% of detected peak area belonged to the target peak under those conditions, not that the sample is 99% pure in every sense.
What is the rule of 3 in HPLC?
The rule of 3 is a system suitability guideline used in method validation: the resolution between the target peak and the nearest impurity peak should be at least 3.0, and the target peak should elute at least three column volumes after the solvent front. It helps confirm the method can separate what it needs to separate before results are trusted. Researchers should verify the specific acceptance criteria in the method or pharmacopeial chapter being followed, because values vary by application and detection mode.
Can HPLC purity confirm a peptide’s identity?
No. HPLC peptide identity testing separates components and quantifies relative peak area, but it does not establish molecular identity. A sample of the wrong compound could still show a high purity percentage if it lacks contaminants. Identity is typically confirmed by an orthogonal method such as mass spectrometry, which gives molecular mass, or by techniques such as amino acid analysis or NMR where appropriate. Researchers should treat HPLC purity and identity as separate questions answered by separate methods.
What are peak purity angle and threshold?
Peak purity angle and threshold are parameters from diode-array detector (DAD) peak-purity assessment. The software compares spectra across a peak; the purity angle summarizes spectral differences, and the purity threshold is a calculated limit based on noise. When the purity angle is below the threshold, the peak is considered spectrally pure within the method’s limits. This helps flag co-elution of structurally similar compounds, but it cannot detect an impurity with an identical spectrum, so it supplements rather than replaces chromatographic resolution.